Delhi's post-Diwali smog: why air quality readings ranged from 344 to 1,000
Delhi woke to thick smog on Monday 9 November after Diwali, with eight to 15 official monitoring stations in the 'severe' band at different points of the morning, while the city's official 24-hour AQI stood at 370 at about 9am and eased to 344 by late afternoon. Private platforms reported far higher numbers, largely because they use different scales and methods.
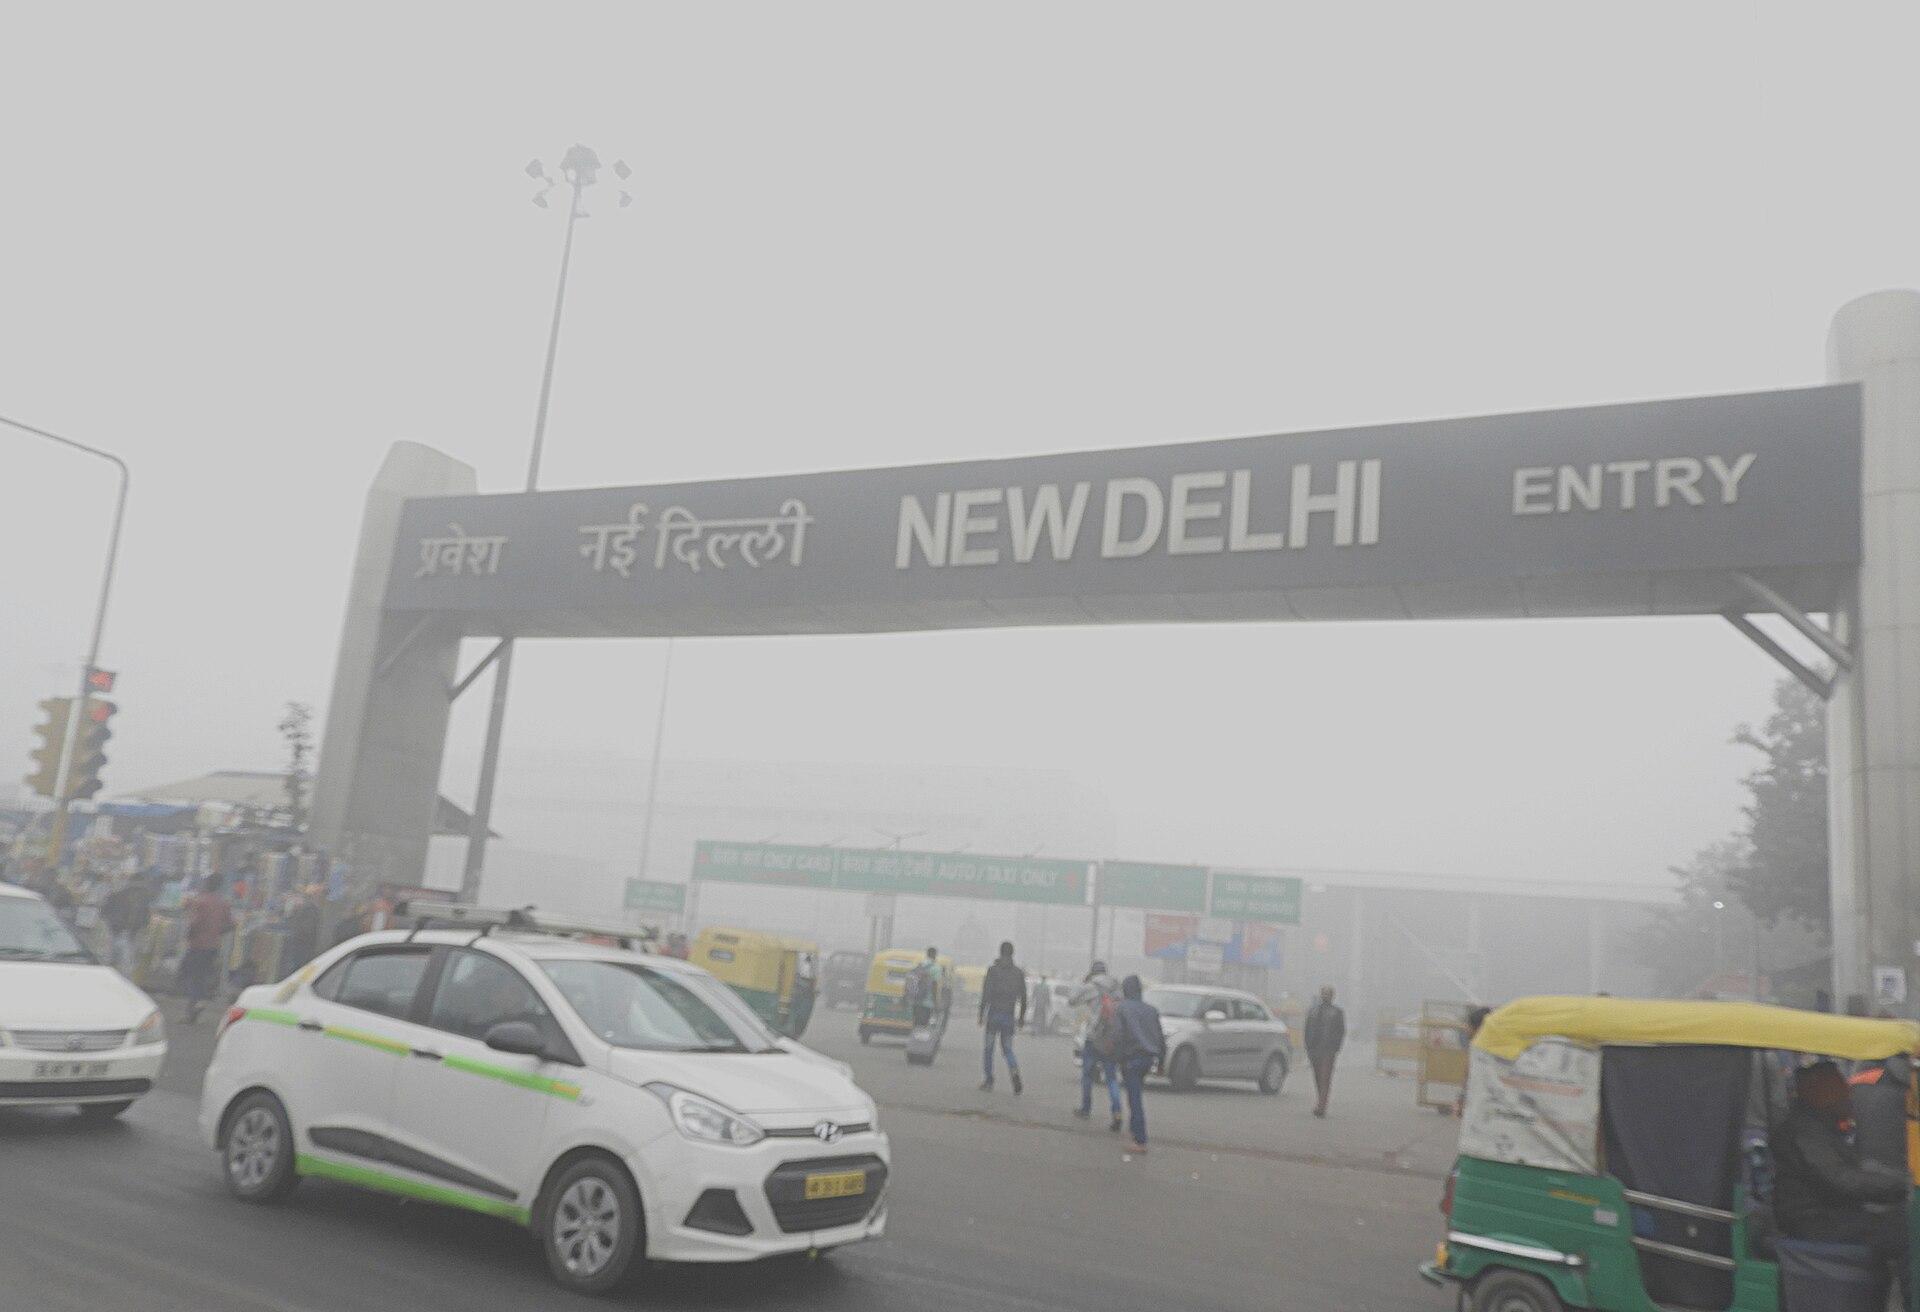
Delhi woke up to dense, acrid smog on Monday 9 November 2026, the morning after Diwali, as firecracker smoke combined with calm, dry weather and the region's usual winter pollution. The city's official 24-hour average Air Quality Index (AQI) from the Central Pollution Control Board (CPCB) was 370 at about 9am, in the "very poor" band, while several individual monitoring stations went above 400, the threshold for "severe". By late afternoon the official figure had eased to 344, News18 reported, citing CPCB data.
At the same time, some private air quality apps showed numbers above 1,000 for parts of the city. Those figures are not directly comparable with the official index, and the gap between them caused confusion on Monday. Experts also raised questions about missing data from official stations during the worst hours of the night.
How bad was Delhi's air the morning after Diwali?
Different outlets captured the official readings at different times, which is why the numbers vary:
- The CPCB's city-wide 24-hour average AQI stood at 370 at 9.05am, The Indian Express and The Hindu reported, citing CPCB data.
- The Hindu, citing the CPCB live dashboard, said the hourly city reading touched 404 at 4am.
- At around 9am, The Indian Express counted eight stations above 400, led by Mundka (425), Vivek Vihar (421) and North Campus (419). NDTV reported that at least 15 stations breached 400 at points during the morning, with Burari Crossing at 441, Vivek Vihar at 445 in one reading and 437 in a separate CPCB hourly log, and ITO at 407.
- NDTV also reported an official figure of 483 at 8.10am. It did not make clear whether that was a single station or a city-wide reading, so it should be treated with caution.
- Delhi's 24-hour AQI was 344 at 4.53pm, compared with 376 on 8 November, 369 on 7 November and 382 on 6 November, according to CPCB data cited by News18.
Underneath the index, the particle counts were extreme overnight. An Indian Express analysis of hourly data from 59 continuous monitoring stations found the city-wide average concentration of PM2.5, the fine particles most linked to health harm, rose from about 117 micrograms per cubic metre (µg/m³) at 5pm on Diwali day to 493 µg/m³ by 11pm and 584 µg/m³ at 1am on Monday. The highest hourly reading at a single station, 998.9 µg/m³ at Delhi University's North Campus, was more than 16 times India's 24-hour standard of 60 µg/m³, the paper noted, though it cautioned that this compares an hourly peak with a 24-hour standard.
Visibility suffered too. India Meteorological Department records cited by The Indian Express showed visibility at Safdarjung falling to 50 metres by 6.30am, with dense fog persisting there for six and a half hours, under calm winds.
How does this compare with previous Diwalis?
By the CPCB's daily average AQI, Diwali day itself (8 November) recorded 376, higher than in each of the previous four years (345 in 2025, 328 in 2024, 218 in 2023 and 312 in 2022), but below 382 in 2021, 414 in 2020 and 435 in 2016, according to The Indian Express. It called it the worst Diwali-day air since 2021.
The morning-after reading of 370 was likewise worse than the equivalent figures for 2022 to 2025, but better than 2016, 2020 and 2021. The Centre for Research on Energy and Clean Air (CREA), an independent research group, said Diwali 2026 was the fourth most polluted day of the year so far in Delhi by daily average PM2.5, at 257 µg/m³, News18 reported. CREA also ranked 5, 6 and 7 November among the year's ten most polluted days, a reminder that the air was already bad before the festival.
Why do some apps show an AQI above 1,000 when the official figure is under 500?
This was the biggest source of confusion on Monday. NDTV reported that the Swiss company IQAir showed readings above 1,000 in Shahdara and Defence Colony, and The Indian Express said the private platform AQI.in reported 955 on a US-standard scale and 787 on its own India-standard calculation, while the CPCB figure was 370.
There are several reasons for the gap:
- The official scale stops at 500. India's AQI is designed as a public health communication tool with six bands: good (0–50), satisfactory (51–100), moderate (101–200), poor (201–300), very poor (301–400) and severe (401–500). Anything beyond the concentration that corresponds to 500 is shown as 500 or "500+", even if particle levels keep climbing.
- Different formulas. An AQI is not a direct measurement. It converts pollutant concentrations into a single number using "breakpoints". India's breakpoints differ from those of the US Environmental Protection Agency, which many private platforms use, so the same air can produce very different index values.
- Different locations and averaging. Official city figures are 24-hour averages across many stations, while apps often show a single sensor's latest hourly reading. A neighbourhood sensor during the peak hour will look far worse than a citywide daily average.
In short, a reading of 1,000 on one app and 370 on the CPCB dashboard can both be accurate descriptions of different things. The official index tells you which band the city is in; it does not show how far past the top band pollution has gone.
Was data missing from official monitors?
Yes, according to experts and news agencies. Manoj Kumar, an air quality analyst at CREA, told News18 that hourly PM2.5 data was missing from 36 of Delhi's 59 monitoring stations at 1am on 9 November, close to the overnight peak. "When data from so many stations is unavailable, the city's overall average PM2.5 concentration can come down, and we may not get an accurate picture of pollution levels at that particular time," he said.
Kumar said the improvement later in the day was not only down to missing data; better winds on Monday morning also helped disperse pollutants across the region. NDTV, citing the news agency IANS, separately reported that the Delhi Pollution Control Committee's website stopped displaying live readings from several stations for a few hours. News18 also noted that the CPCB's public portal does not display PM2.5 values above 1,000 µg/m³; Siri Fort hit that ceiling.
The problem was not limited to Delhi. The Hindu reported that Telangana Pollution Control Board monitors in Hyderabad were out of order as pollution rose on the night of 8 November.
What restrictions are in force in Delhi-NCR?
Stage III of the Graded Response Action Plan (GRAP), the four-stage emergency framework run by the Commission for Air Quality Management (CAQM), has been in force across Delhi and neighbouring districts of Haryana, Uttar Pradesh and Rajasthan since Friday 6 November, when the city's AQI was 382. Authorities can invoke a stage in advance, based on forecasts from the India Meteorological Department and the Indian Institute of Tropical Meteorology.
According to The Indian Express and Times Drive, Stage III measures include:
- a ban on non-essential construction and demolition work, including excavation and road building;
- a ban on BS-III petrol and BS-IV diesel (or older) four-wheelers in Delhi and the high-density NCR districts of Gurugram, Faridabad, Sonipat, Ghaziabad and Gautam Buddha Nagar (Noida), with exemptions such as vehicles adapted for people with disabilities;
- curbs on some diesel goods vehicles, stone crushers and mining;
- hybrid classes for children up to Class V, subject to exemptions.
Stage IV, the strictest level, can be invoked when the AQI exceeds 450 or is forecast to. It brings tighter curbs on truck entry and school attendance. The Indian Express reported that it had not been invoked as of Monday morning.
Why did firecrackers have such an effect despite the rules?
The Supreme Court had allowed only certified "green" crackers in Delhi-NCR, and only between 6am and 7am and between 8pm and 10pm on 7 and 8 November, with a full ban returning on 9 November. The Hindu and The Indian Express reported that crackers were burst well past the permitted hours and that more polluting conventional crackers were available in markets.
Green crackers, developed by the CSIR's National Environmental Engineering Research Institute, are formulated to cut some emissions, but they still release particles and gases, especially when used in large numbers, The Indian Express noted. The overnight rise in sulphur dioxide, from daytime averages of around 14–21 µg/m³ to 58 µg/m³ at 11pm, is consistent with combustion such as fireworks, the paper said, though hourly data alone cannot prove the source.
Fireworks are only one part of the picture. Delhi's winter pollution also comes from vehicles, construction dust, industry and crop-residue burning in neighbouring states, and cold, still air traps it close to the ground.
Which other Indian cities were affected?
The smog was not confined to the capital. The Hindu reported "poor" AQI readings on Monday in cities including Lucknow, Amritsar, Jodhpur, Ahmedabad, Jaipur, Nagpur and Pune. In Mumbai, Kherwadi-Bandra East recorded 264, and Chennai's AQI fell into the "poor" band at 213 on the CPCB's Sameer app. A private sensor at the Chennai home of weather blogger K. Srikanth showed readings of around 1,000 for nearly four hours on Diwali evening.
What happens next?
The CAQM reviews GRAP stages as forecasts change, so restrictions can be tightened to Stage IV or eased. Residents can check the CPCB's Sameer app or the CAQM's official notices for the stage in force. The Air Quality Early Warning System had predicted conditions would worsen through Monday because of unfavourable weather, NDTV reported, while better winds helped later in the day. With crop-residue burning in the region and colder nights ahead, Delhi typically faces more high-pollution days through November and December.
Image: Photo: Sumita Roy Dutta, CC BY-SA 4.0 (https://creativecommons.org/licenses/by-sa/4.0/), via Wikimedia Commons (https://commons.wikimedia.org/wiki/File:Low_visibility_due_to_Smog_at_New_Delhi_Railway_station_31st_Dec_2017_after_9AM_DSCN8829_1.jpg) — 31 December 2017 file photo of smog in New Delhi, not taken this week
About this article: prepared by The Daily Context editorial desk using automated, source-based reporting from the publications linked below. No reporter was on the ground.
Sources
- The Indian Express (Sophiya Mathew), 9 November 2026: https://indianexpress.com/article/cities/delhi/delhi-aqi-pollution-severe-category-diwali-smog-10955880/
- The Indian Express Explained Desk, 9 November 2026: https://indianexpress.com/article/explained/explained-climate/delhi-aqi-today-cpcb-private-readings-difference-grap-rules-10956037/
- News18 (Saurabh Verma), 9 November 2026: https://www.news18.com/amp/cities/new-delhi-news/delhi-air-pollution-aqi-immprove-diwali-experts-stubble-burning-10418937.html
- NDTV, 9 November 2026: https://www.ndtv.com/delhi-news/delhi-air-quality-spikes-to-severe-levels-post-diwali-despite-grap-iii-curbs-12301814
- The Hindu, 9 November 2026: https://www.thehindu.com/news/national/post-diwali-air-pollution-delhi-hits-severe-as-air-quality-index-aqi-soars-across-major-indian-cities/article71681352.ece
- Times Drive, November 2026: https://www.timesdrive.in/news/grap-3-implemented-bs3-petrol-bs4-diesel-cars-banned-in-delhi-ncr-check-if-your-car-is-affected-article-156484722
Kabeer Ahmad
Kabeer Ahmad is the founder and editor of The Daily Context. He oversees the site's source-based coverage of world affairs, technology, business, entertainment, lifestyle and sports, and is responsible for its editorial standards, sourcing and corrections.